Fig. 2.

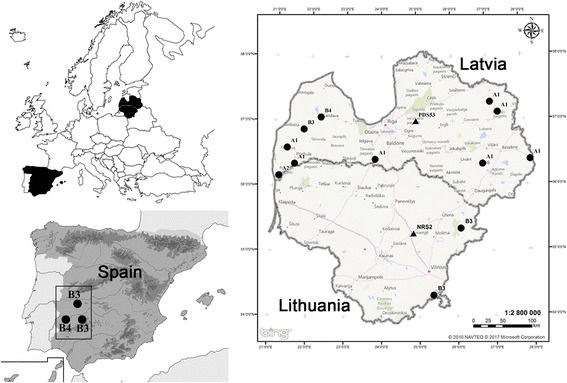
Distribution of S. arctica and S. lutrae in the sampled area and genotypes of S. arctica within cox1 and rpoB. Distribution of S. arctica is represented in black circles and S. lutrae in black triangles

Distribution of S. arctica and S. lutrae in the sampled area and genotypes of S. arctica within cox1 and rpoB. Distribution of S. arctica is represented in black circles and S. lutrae in black triangles