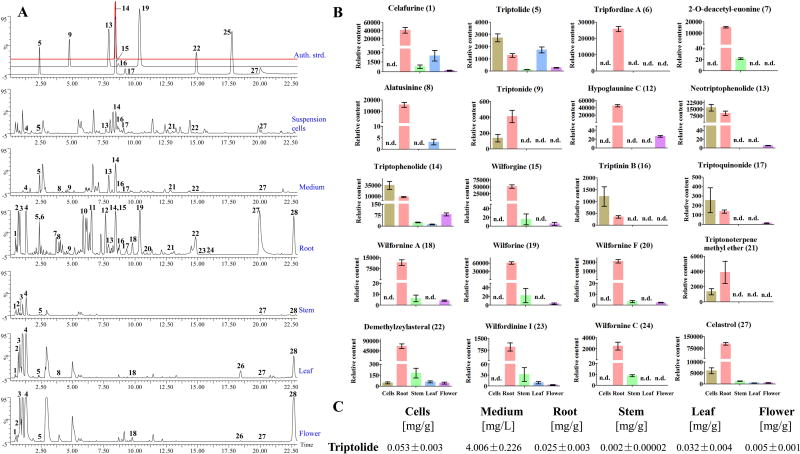
Figure 2.
Comparison of extracts from T. wilfordii suspension cells and whole plant organs. (A) BPI chromatograms of extracts from suspension culture cells and medium, and plant root, stem, leaf, and flower tissues by UPLC/Q-TOF MS. The identities of the metabolite peaks 1 to 28 are listed in Table 1. (B) Relative content of the identified metabolites from suspension cells, culture medium, root, stem, leaf, or flower. (C) Concentrations of triptolide in suspension cells, culture medium, root, stem, leaf, or flower.

