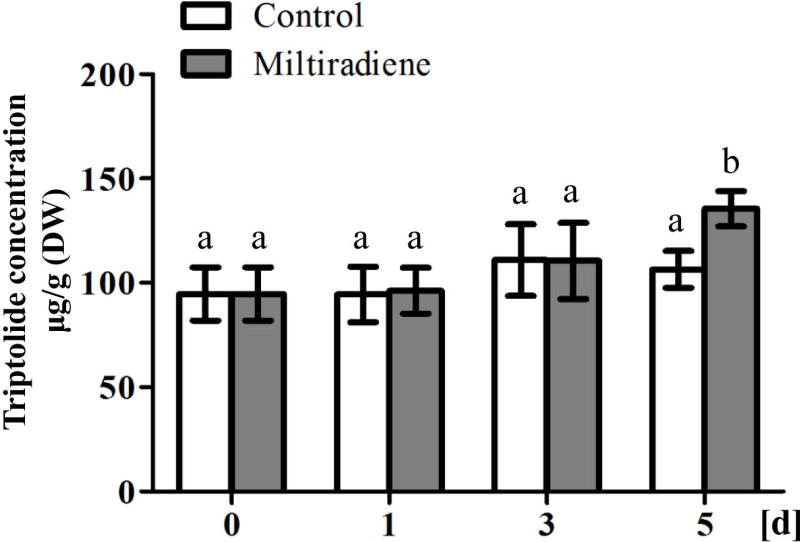
Figure 3.
Triptolide content in suspension cells fed with miltiradiene as measured by UPLC. The data represent the averages ± standard deviations from analysis of at least four independent lines of suspension cell cultures (lettering indicates statistically significant difference from all-by-all comparison using the Student’s t-test).

