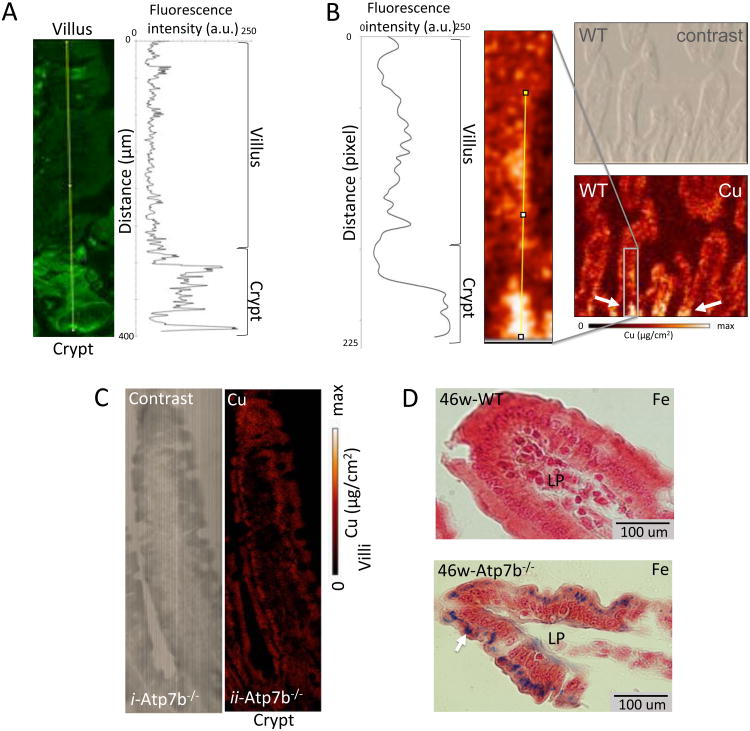
Figure 2. ATP7B and Cu are co-distributed in intestinal epithelium.
The pattern of ATP7B expression, quantified by intensity of immunostaining (A), matches Cu the distribution profile analyzed by XFM (B). (A) Image of the crypt-villus axis (left) with fluoro-antibody labeled ATP7B (green) and plot of fluorescence intensity vs distance (right). (B) Quantitation of X-ray Cu fluorescence (left); magnified XFM image of Cu distribution (middle), phase-contrast image of tissue (top right) and corresponding XFM image (bottom right). The grey block shows magnified area, the white arrows point to the crypt region where Cu is elevated. C) XFM images of duodenal tissue (bottom) and phase contrast (top) images from a 46 week old Atp7b-/- mouse. Cu levels are uniform on the crypt villus axis when ATP7B is knocked out. D) Prussian blue (histological detection of iron) stained duodenal tissue from WT (top) and Atp7b-/- (bottom) animals. Images were taken at the distal end of villi. Laminia propria is indicated by ‘LP’ and dark blue spots indicate iron accumulation (white arrow).

