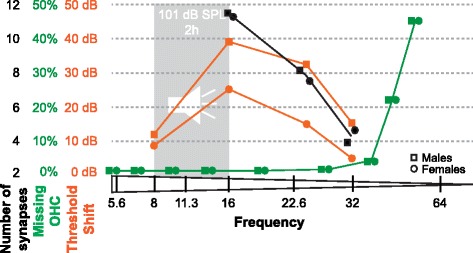
Fig. 7.

Schematic showing the threshold shifts in relation to missing outer hair cells and number of active synapses. Loss of OHC (green) and decrease in the number of active synapses (black) does not correlate with the highest threshold shift (orange) following noise exposure detected at 16 kHz. The difference in threshold shifts between male and female mice is not explained by a difference in OHC loss or active synapse numbers
