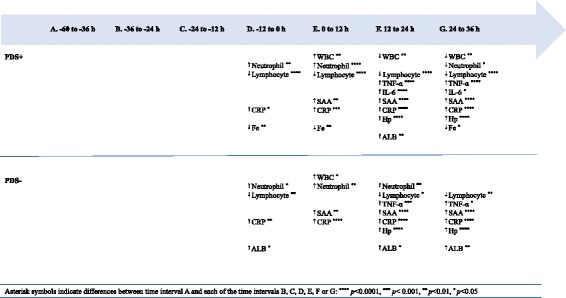
Fig. 11.

Changes in levels of inflammatory markers over time in 38 sows with postpartum dysgalactia syndrome (PDS+) and 38 healthy (PDS-) sows, with asterisk symbols indicating significant differences between time interval A and the subsequent time intervals (D to G). Upward pointing arrows indicate increasing concentrations. Downward pointing arrows indicate decreasing concentrations
