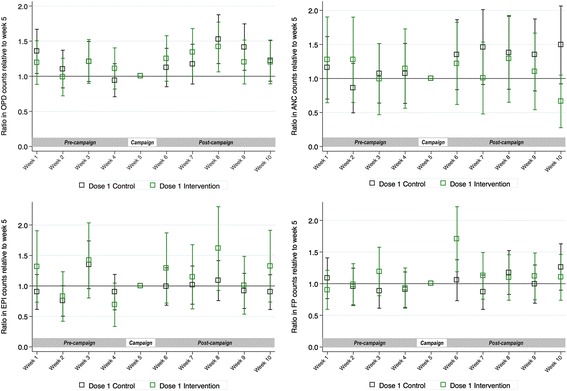
Fig. 2.

Ratios, and 95% confidence intervals, of mean counts of the four activity indicators during dose 1 delivery, comparing the weeks before and after the vaccine campaign with week 5 (HPV vaccine campaign week), or the equivalent time periods in control facilities1. 1Estimatated by the negative binomial regression model adjusted for district, facility type (dispensary or health centre), catchment population, total clinical staff per 1000 catchment population per facility, timing of other campaigns
