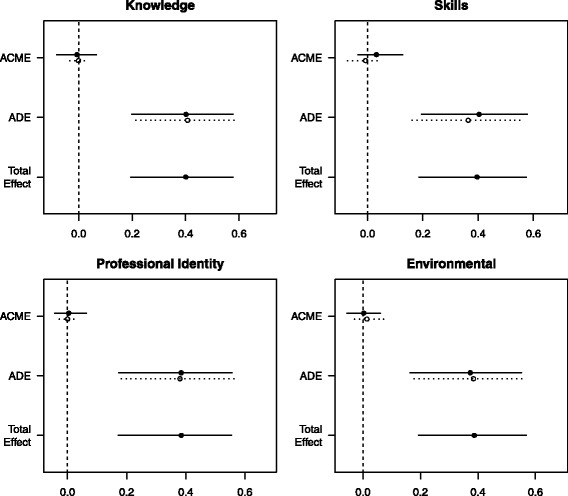
Fig. 3.

Effect decomposition plots for each mediator model. ACME average causal mediation effect, ADE average direct effect. Solid dots and lines represent point estimates and 95% confidence limits for the intervention group; the hollow dots and broken lines represent point estimates and confidence limits for the usual care group. The total effect is displayed as an average effect. All effects are reported unstandardized with their 95% confidence intervals
