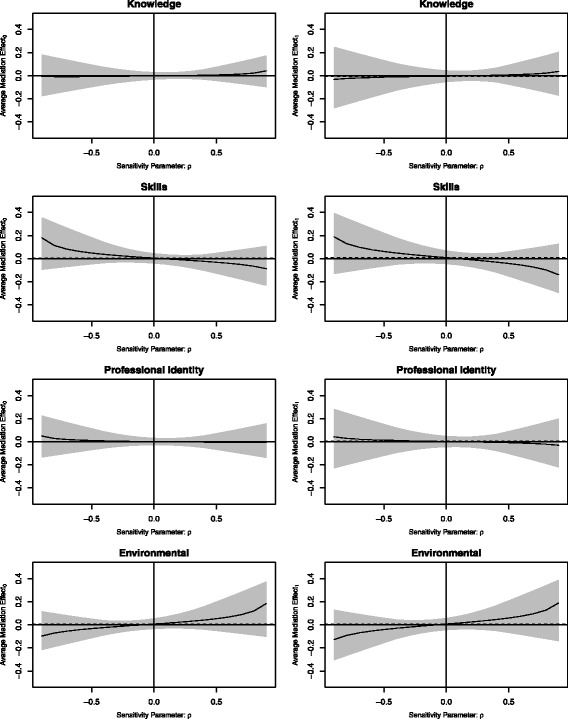
Fig. 4.

Sensitivity plots. The average mediation effects are plotted as a function of the sensitivity parameter (magnitude of residual confounding). A sensitivity parameter of 0 represents null hypothesised levels of residual confounding and the extremes of − 1 and 1 represent maximum hypothesised levels of residual confounding. Grey zones represent 95% confidence limits of the estimated mediation effect across a range of hypothesised levels of residual confounding
