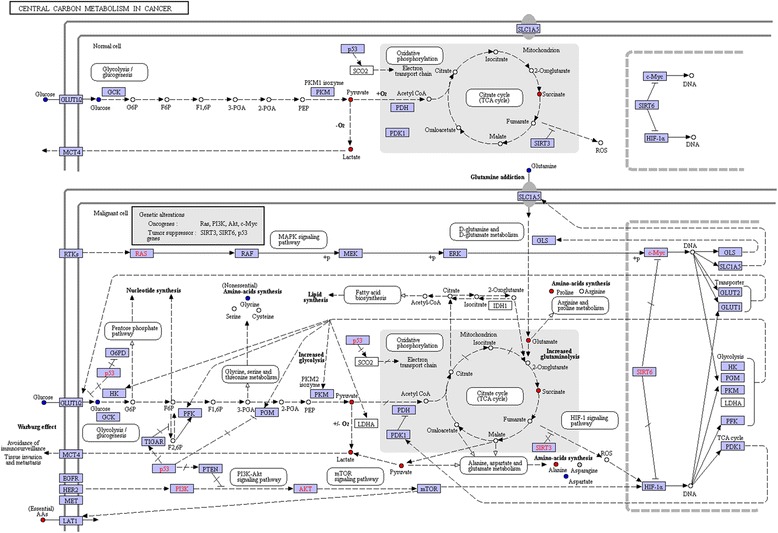
Fig. 7.

The metabolites and corresponding affected metabolic pathways generated by KEGG mapper. Nodes in red and blue denoting metabolites with increased and decreased concentrations in NSCLC group. Genetic alternations including oncogenes such as Ras, PI3K, Akt and c-Myc, and tumor suppressor genes such as SIRT3, SIRT6 and p53 were observed
