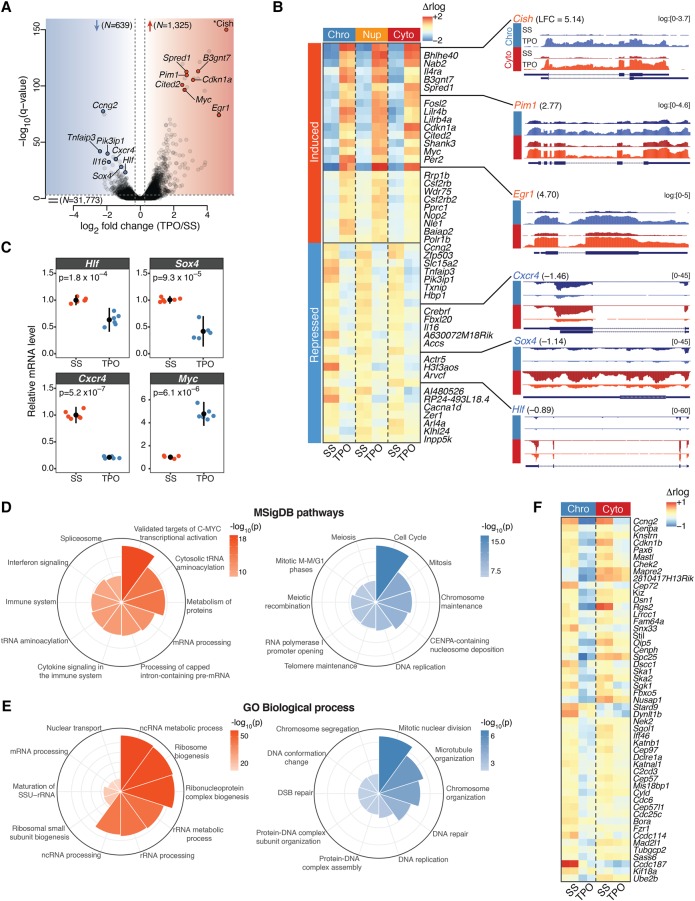
Figure 1.
The immediate early transcriptional response to TPO signaling. (A) Volcano plot of gene transcription changes induced by 30 min stimulation of HPC-7 cells with TPO relative to serum-starved (SS) control cells, based on chromatin-associated RNA expression. Red and blue shaded regions enclose transcriptionally up- and down-regulated genes (Q-value <10−3), respectively. The total number of genes within each category is indicated. Representative hits are labeled. The asterisk denotes the most strongly induced gene (Cish, Q = 1.8 × 10−241), which was repositioned within the plot area. (B, left) Chromatin-associated (Chro), nucleoplasmic (Nup), and cytoplasmic (Cyto) RNA expression heatmap for the top 25 induced and top 25 repressed genes ranked by Q-value. Regularized log2 (rlog) expression values are row-mean subtracted. (Right) Representative tracks of differentially transcribed genes. Where indicated, RNA-seq coverage was log transformed with a pseudocount of 1. (LFC) log2 fold change. (C) mRNA expression levels of the indicated genes in TPO-treated (30 min) primary CD41+LSK cells, relative to serum-starved (SS) control cells, measured by quantitative RT-PCR. Error bars are mean ± SD (n = 6) from two mice. P-values are from a two-sided Welch's t-test. (D) Top 10 significantly enriched Molecular Signature Database (MSigDB) pathways for transcriptionally up- (left) and down-regulated (right) genes, ranked by binomial P-value. (E) Same as D, for Gene Ontology (GO) biological process terms. (F) Chromatin-associated (Chro) and cytoplasmic (Cyto) RNA expression heatmap of mitotic genes. Regularized log2 (rlog) expression values are row-mean subtracted.

