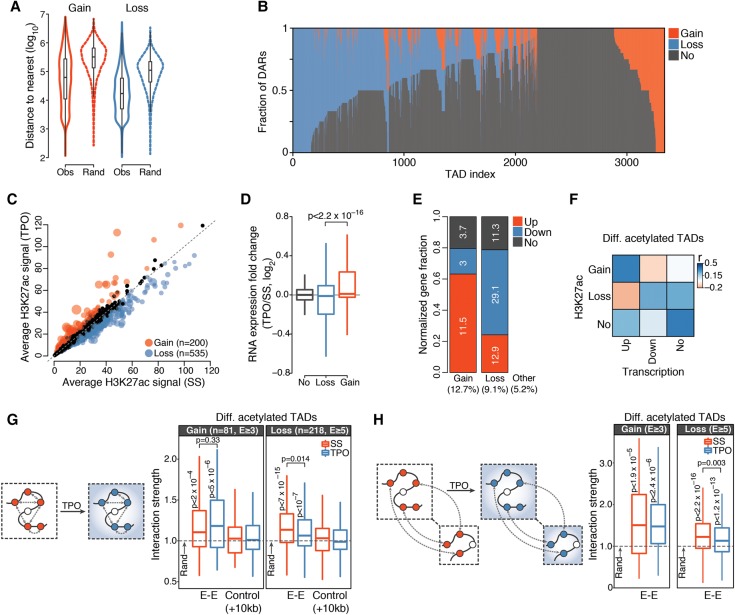
Figure 3.
Cis-regulatory responses to TPO are spatially coordinated within the nucleus. (A) Distribution of observed (Obs) and expected (Rand) (Methods) genomic distances between nearest homotypic DARs. (B) Distribution of DARs within TADs detected in serum-starved HPC-7 cells and containing at least one H3K27ac region. Each TAD corresponds to a vertical line. (C) Average normalized H3K27ac signals per kilobase of TAD. Significantly differentially acetylated TADs are highlighted. Point sizes are proportional to −log10(Q-value). (D) Distribution of chromatin-associated RNA expression fold changes of genes localized within differentially acetylated TADs. P-value is from a Wilcoxon rank-sum test. (E) Relative fraction of differentially transcribed genes localized within differentially acetylated TADs, normalized by total number of genes within each category. The percentage of genes in each category is indicated inside the bar plot, whereas the percentage of differentially transcribed genes falling within each TAD class is indicated at the bottom. (F) Spearman's rank correlation matrix between frequency of DAR and frequency of differentially transcribed genes within differentially acetylated TADs. (G) Structured interaction matrix analysis (SIMA) of enhancer–enhancer interactions for differentially acetylated enhancers within differentially acetylated TADs. The interaction strength reflects the enrichment of Hi-C interactions relative to randomly sampled genomic regions. Interaction strength distributions for matched controls (Methods) are also shown. P-values are from a Wilcoxon signed rank test (for testing differences from random interactions) and from a Wilcoxon rank-sum test (for comparison between conditions). (H) Same as G, for enhancer–enhancer interactions between differentially acetylated TADs located within 20 Mb blocks.

