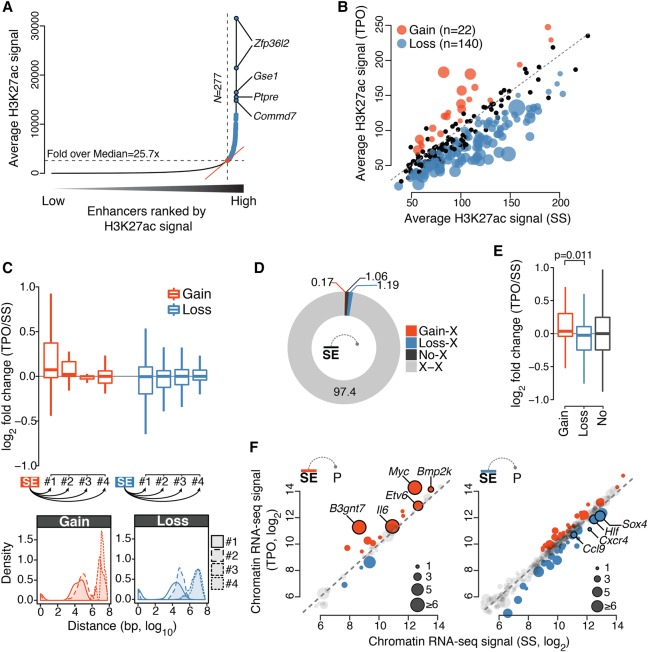
Figure 4.
TPO signaling is integrated at super-enhancers. (A) Distribution of average (control-subtracted) normalized H3K27ac ChIP-seq signals at enhancer regions in serum starved HPC-7 cells. Super-enhancers (SEs, blue) exhibit exceptionally high H3K27ac levels. (B) Average normalized H3K27ac signal per kilobase of SE. Significantly differentially acetylated SEs are highlighted. Point sizes are proportional to −log10(Q-value). (C, top) Distribution of chromatin-associated RNA expression fold change for first, second, third, and fourth nearest gene to a differentially acetylated SE. (Bottom) Corresponding distribution of genomic distances. (D) Percentage of significant promoter Capture Hi-C interactions anchored at SEs. (X) any HindIII restriction fragment located outside SEs. (E) Distribution of chromatin-associated RNA expression fold changes of SE-target genes defined by promoter Capture Hi-C. P-value is from a Wilcoxon rank-sum test. (F) Chromatin-associated RNA expression (regularized log2 values) of gene targets of differentially acetylated SE as defined in E. Point sizes are proportional to the number of constituent enhancers exhibiting significant interactions with the gene promoter. Selected SE targets are labeled.

