Figure 5.
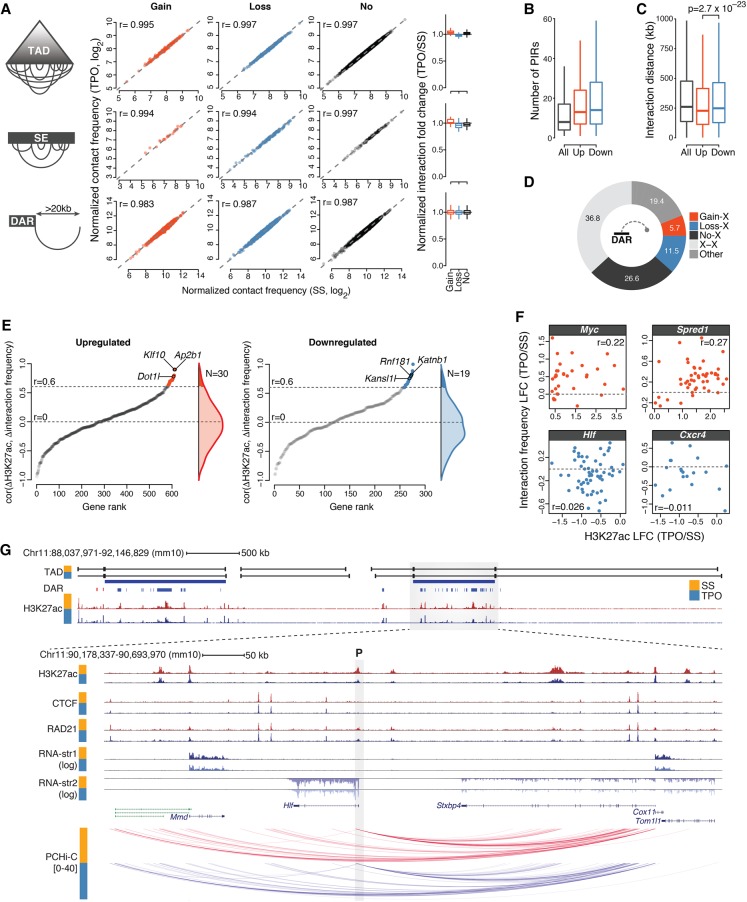
Rapid modulation of cis-regulatory activities within poised chromatin architectures. (A) Normalized Hi-C contact frequencies for intra-TAD and intra-SE interactions (per kilobase of element), and for interactions anchored at DARs spanning more than 20 kb. Spearman's rank correlation coefficients (r) are shown. Box plots (right) summarize normalized interaction fold change distributions. (B) Distribution of the number of promoter-interacting regions (PIRs) for all baited promoters (All) and promoters of transcriptionally up- and down-regulated genes. (C) Distribution of interaction distances for all baited promoters (All) and promoters of transcriptionally up- and down-regulated genes. P-value is from a Wilcoxon rank-sum test. (D) Percentage of significant promoter Capture Hi-C interactions anchored at DARs. (X) any HindIII restriction fragment located outside DARs. (E) Relationship between cis-regulatory activity and chromatin architectures at cis-regulatory units for transcriptionally up- and down-regulated genes (Methods). Genes are ranked based on the Spearman's rank correlation coefficient (r) between normalized H3K27ac fold change (TPO/SS) and normalized Capture Hi-C interaction fold change at target DARs. Only promoters exhibiting significant interactions with at least five distinct DAR-containing HindIII restriction fragments were considered. Genes exhibiting significant correlations are colored, and representative hits are labeled. (F) Representative examples from the analysis in E. Each dot corresponds to an HindIII restriction fragment. (LFC) log2 fold change. (G) Epigenomic configuration of the Hlf locus. Statistically significant promoter Capture Hi-C interactions within the Hlf TAD are shown. The gray shaded rectangle denotes the position of the baited Hlf promoter (P). (str) strand.

