Figure 6.
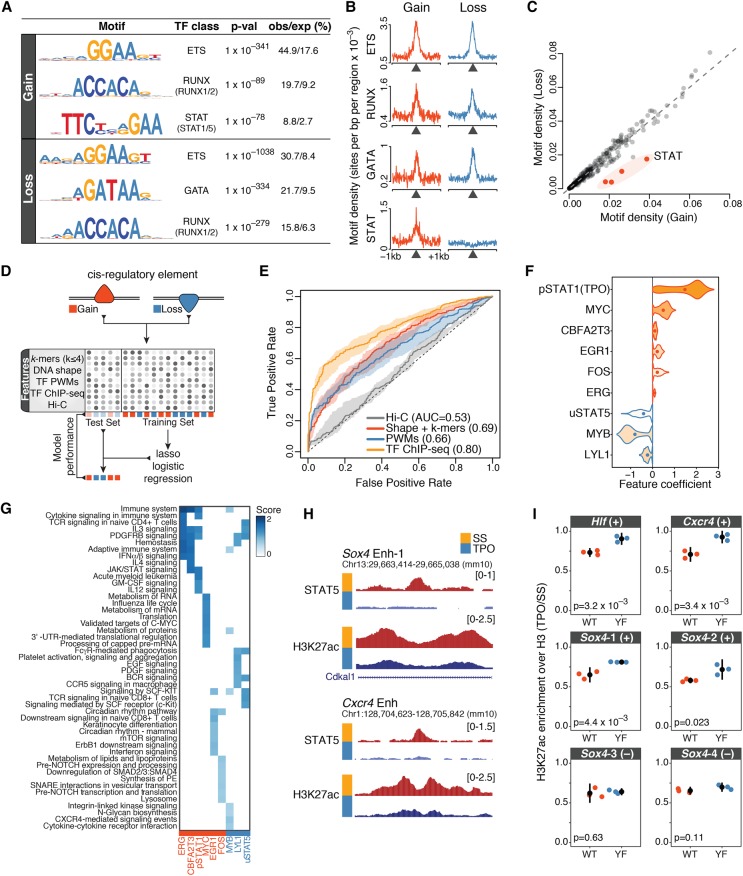
TF binding patterns accurately predict rapid cis-regulatory responses to TPO. (A) Top transcription factor motifs (position weight matrices [PWMs]) identified by de novo motif discovery analysis within 200 nt of the summit of differentially acetylated DHSs (Methods). The percentage of observed and expected motif occurrence is indicated. (B) Motif density (PWMs) for the indicated transcription factor motifs within ±1 kb of the summit of differentially acetylated DHSs. (C) Total motif density within 200 nt of the summit of differentially acetylated DHSs, for a collection of 363 vertebrate transcription factor PWMs. (D) Schematic outline of the statistical learning strategy used to predict how cis-regulatory elements within DARs respond to TPO. (E) Test set receiver operating characteristic (ROC) curve and area under the ROC curve (AUC) values for lasso models trained on the indicated sets of features. The shaded area is delimited by the ROC curves for models with highest and lowest AUC values, whereas the ROC curve for the model closest to mean AUC is shown. (F) Top-ranked features selected by bootstrap-Lasso for the model trained on TF ChIP-seq profiles, ranked by selection probability (stability). Violin plot lines are color-coded according to coefficient signs: (red) positive; (blue) negative. (G) Genomic regions enrichment of annotations tool (GREAT) analysis of differentially acetylated cis-regulatory elements bound by TFs in F. The top eight significantly enriched Molecular Signature Database (MSigDB) pathways were considered for each transcription factor, ranked by binomial P-value. (H) Representative tracks illustrating STAT5 binding dynamics at differentially acetylated enhancers within key hematopoietic gene loci. (I) Relative H3K27ac enrichment (TPO/SS, normalized to total H3 levels) at the indicated enhancer elements (uSTAT5-bound [+] or uSTAT5 negative [–, control]) for HPC-7 cells expressing wild-type (WT) or mutant (Y699F) STAT5B. Tested loci include the enhancers shown in H. Error bars are mean ± SD (n = 3). P-values are from a two-sided Welch's t-test.

