Figure 3.
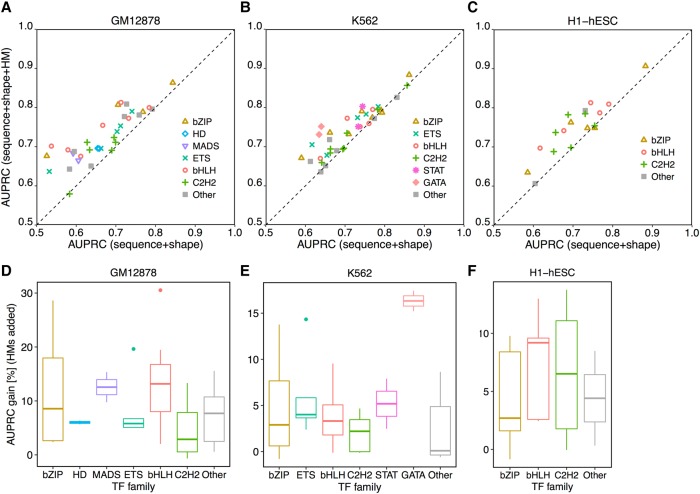
HM patterns of the BS environment largely contribute to the quantitative prediction of in vivo TF binding in a protein family–specific manner. L2-regularized MLR models were implemented to distinguish BSs and non-BSs for TFs from different families. AUPRC was used to measure performance of different models. Comparisons of models are shown between sequence+shape and sequence+shape+HM features in the GM12878 (A), K562 (B), and H1-hESC (C) cell lines. Extents of performance gain in HM-augmented models are protein family specific in the GM12878 (D), K562 (E), and H1-hESC (F) cell lines.

