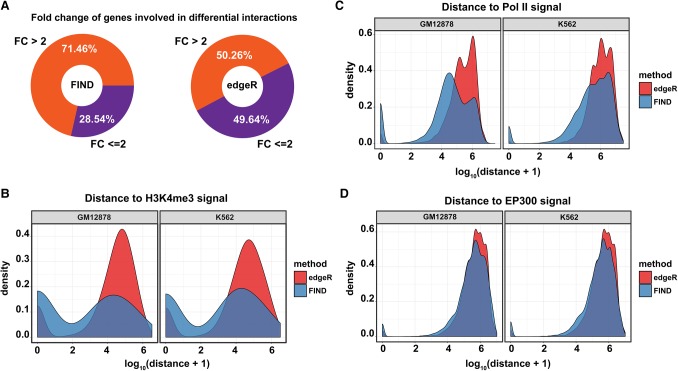
Figure 5.
Comparison of performance between FIND and edgeR with transcriptional characteristics. (A) The proportion of genes with different fold changes located near the DCIs. (B) The distribution of the distances between DCIs and the H3K4me3 peaks. (C) The distribution of the distances between DCIs and the Pol II peaks. (D) The distribution of the distances between DCIs and the EP300 peaks.

