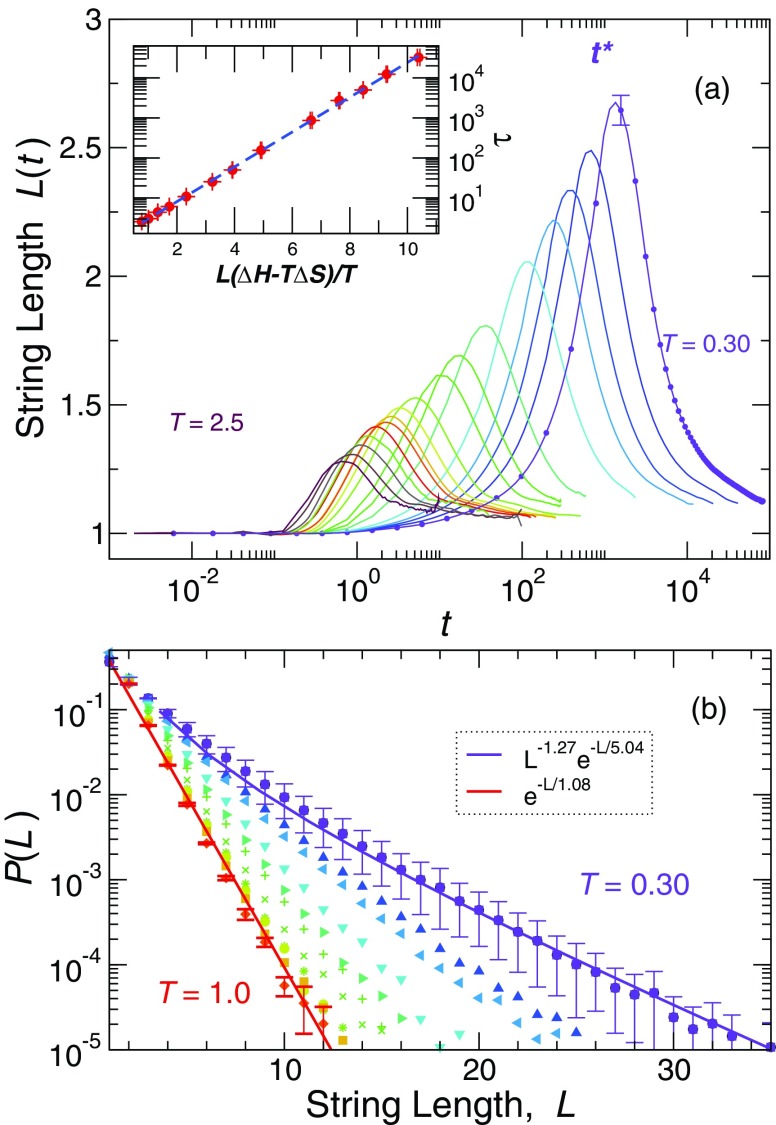
FIG. 2.
(a) Average string length L(t) as a function of interval t for many T approaching Tg. The color gradient indicates T, from violet at T = 0.30 to maroon at T = 2.5. The error bars indicate the statistical uncertainty obtained from four independent runs. The inset shows the α-relaxation time τ can be described by the AG relation (Eq. (4)), where the size of the CRR, z, is exactly identified with string length L. (b) String length distribution P(L) at the characteristic peak time t* of string size. At high T, P(L) has a nearly exponential form (red line for T = 1.0), a canonical property of the linear equilibrium polymers in mean field theory. At low T, there is curvature in P(L) that can be approximately captured by a power-law dependence for small L (violet line at T = 0.30), suggesting a possible change in string topology, as discussed in the text.

