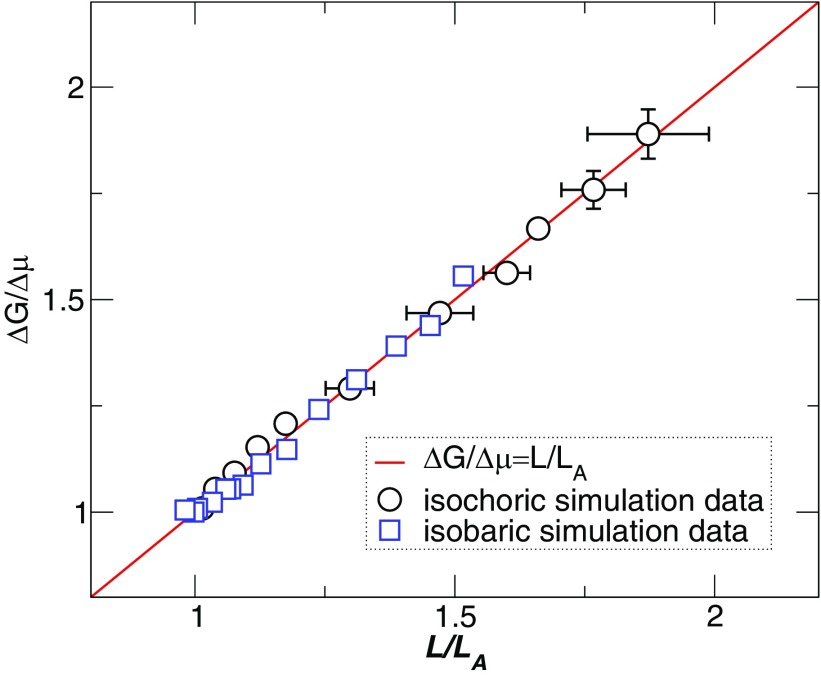
FIG. 5.
Parameter free comparison between L/LA and the expected size of CRR from AG. The circles represent simulation data along a constant density path (using relaxation time data from Ref. 20 in Eq. (3)), and squares are data along constant pressure path (data from Ref. 21). The error bars indicate the statistical uncertainty obtained from four independent runs.

