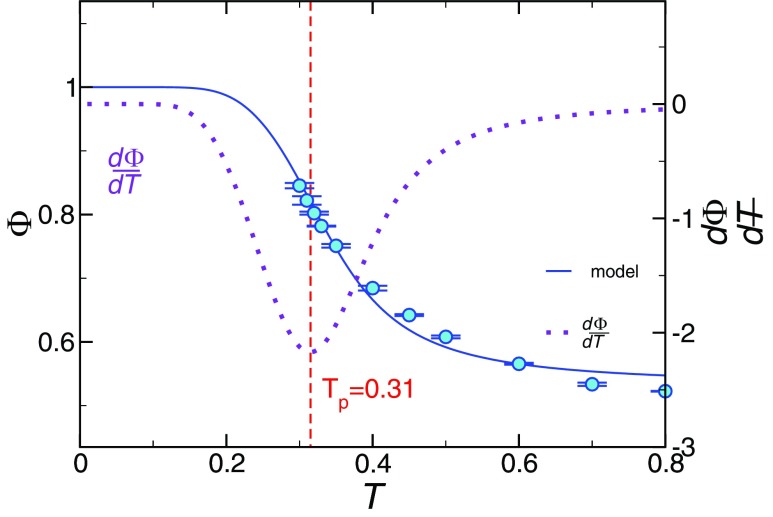
FIG. 6.
Temperature dependance of the extent of polymerization Φ(T). The symbols represent the simulation data. The solid curve represents the model prediction for Φ. The dashed curve illustrates the numerical derivative of Φ(T). The minimum of defines the polymerization transition location Tp, indicated by the vertical line. The error bars indicate the statistical uncertainty obtained from four independent runs.

