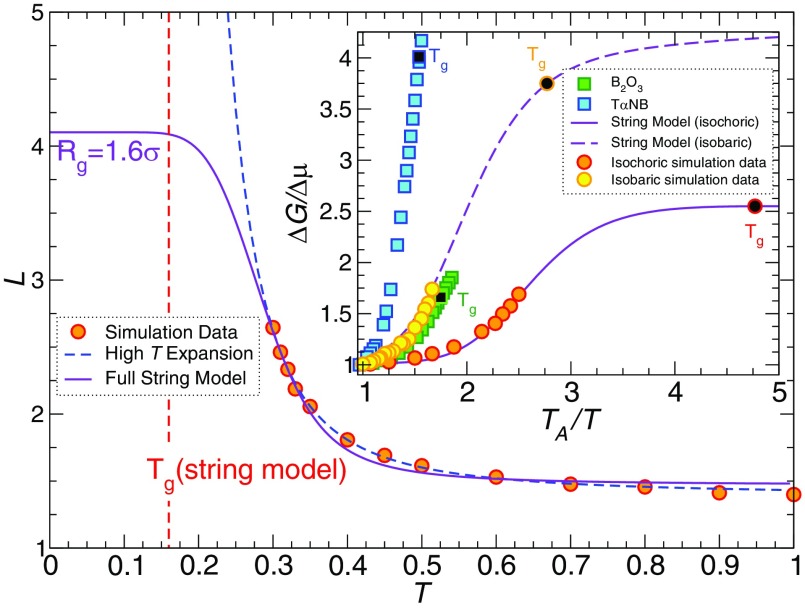
FIG. 8.
Temperature dependance of the string length L(T). The lines in main panel represent the model predictions from the full theory (solid line) and the high T expansion (dashed line). The full theory reaches a plateau at low T, while the high T approximation yields a divergence. (Inset) The comparison of ΔG/Δμ for simulation data and ΔG/Δμ for the experimental values (which should equal L/LA to our simulation data of our glass former model). The experimental data emphasize the similarity to our simulation data. We compare the equilibrium polymer model data both isobaric and isochoric simulation data to show that change does not alter the qualitative trend. Note the somewhat stronger T variation of the reduced activation energy ΔG/Δμ, and thus, fragility in the constant pressure simulations. McKenna and co-workers76 have also found the T dependence of the structural relaxation measurements on polymeric glass-forming liquids to be weaker under constant density conditions.

