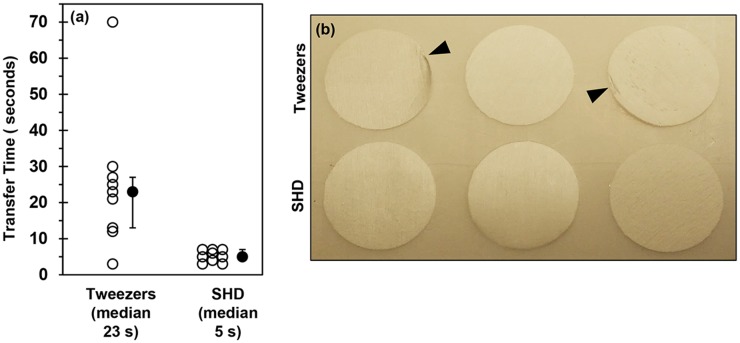
FIG. 4.
(a) Plot of transfer times for SHD vs. tweezers. The time to move the thicker PCL nanofiber scaffolds from a flat surface into a 24-well culture plate was measured. The 12-mm dia. tip was used for the SHD. Open circles are individual data points (n = 9) and black circles are the median with first and third quartiles. Nine scaffolds were moved by tweezers or SHD. The Anderson-Darling normality test indicated that the tweezer data may be non-normal (P = 0.04) and that SHD data may be normal (P = 0.24). A 2-sample non-parametric test was used to compare medians (Mann-Whitney) and indicated that there may be a significant difference between SHD and tweezers (P = 0.005). (b) Photograph of thicker PCL nanofiber scaffolds that were moved into and then out of a 24-well culture plate using either tweezers or the SHD. The top three scaffolds were moved with tweezers and the bottom three scaffolds were moved with the SHD. The arrowheads indicate perturbations to the scaffolds caused by tweezers. Scaffolds are 14 mm in dia.

