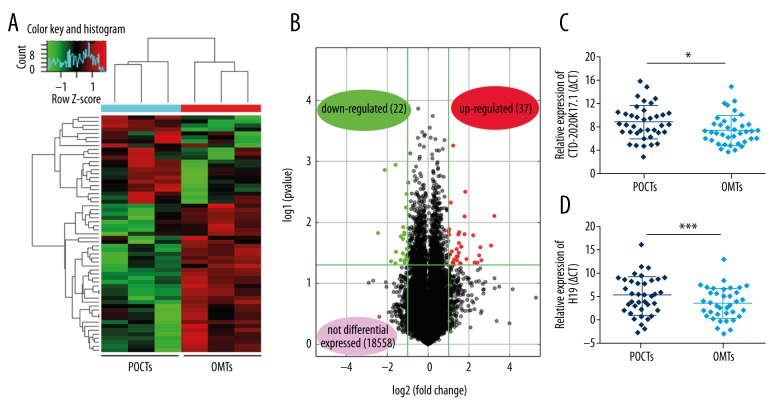
Figure 1.
Expression levels of CTD-2020K17.1 in HGSOC tissues. (A) Hierarchical clustering analysis shows differentially expressed lncRNAs in paired POCTs and OMTs of 3 HGSOC cases (fold change >2.0, P<0.05). (B) Differentially expressed lncRNAs in OMTs compared to POCTs were determined by Volcano Plot. (C, D) CTD-2020K17.1 and H19 expression in POCTs and OMTs are presented as the mean ±SD. Being normalized to GAPDH, a lower ΔCt indicates a higher expression and the expression of CTD-2020K17.1 in OMTs is higher than POCTs. * P<0.05; *** P<0.005.

