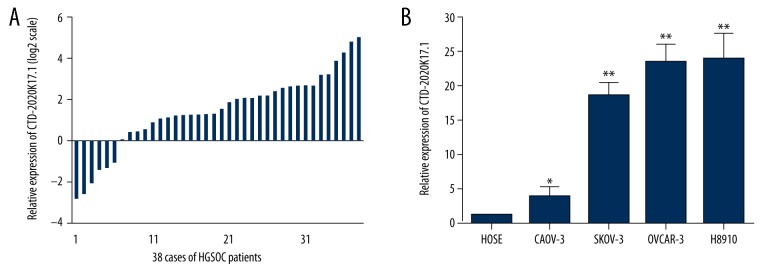
Figure 2.
Expression of CTD-2020K17.1 in ovarian cancer cell lines and tissues. (A) Relative CTD-2020K17.1 expression in OMTs compared with POCTs, presented as log base 2 of the fold change for 38 HGSOC patients. (B) Relative expression levels of CTD-2020K17.1 in 4 ovarian cancer cell lines (CAOV-3, SKOV-3, OVCAR-3, and HO8910), compared with a human ovarian surface epithelial cell line (HOSE) were calculated using the 2-ΔΔCT method. Levels of CTD-2020K17.1 in the 4 ovarian cancer cell lines were higher than in the human ovarian surface epithelial cell line. Data are shown as mean ±SD. * P<0.05, ** P<0.01.

