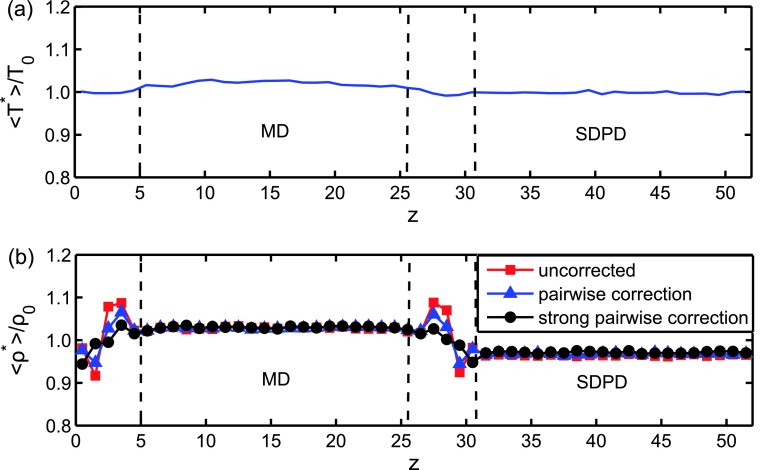
FIG. 3.
(a) Temperature profile for a LJ system coupled to a SDPD domain at equilibrium with a pairwise correction force. The profile is approximately flat, with deviations less than 2.0% from the target temperature. (b) Density profiles for the system. The red curve (squares) is the density without corrections, while the blue curve (triangles) is with a pairwise correction. The densities within the MD/SDPD domains are within 3.2% of the target value with this correction. The black curve (circles) is the density profile when the strength of the pairwise thermodynamic force is increased by a factor of 10. For the MD and buffer regions, densities are computed by binning the system and counting particles, while for the SDPD part of the system, we use the SPH calculation for density [Eq. (7)] at randomly sampled points.

