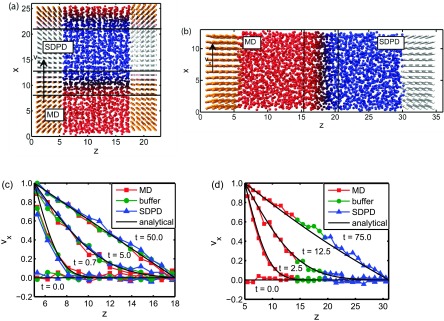
FIG. 4.
Snapshots of the system for the (a) perpendicular and (b) parallel flow cases. (c) Velocity profiles for the MD, buffer, and SDPD domains for perpendicular start-up shear flow as compared to the analytical solution. (d) Velocity profiles for the parallel case. The velocities are averaged over 20 independent trajectories for both scenarios.

