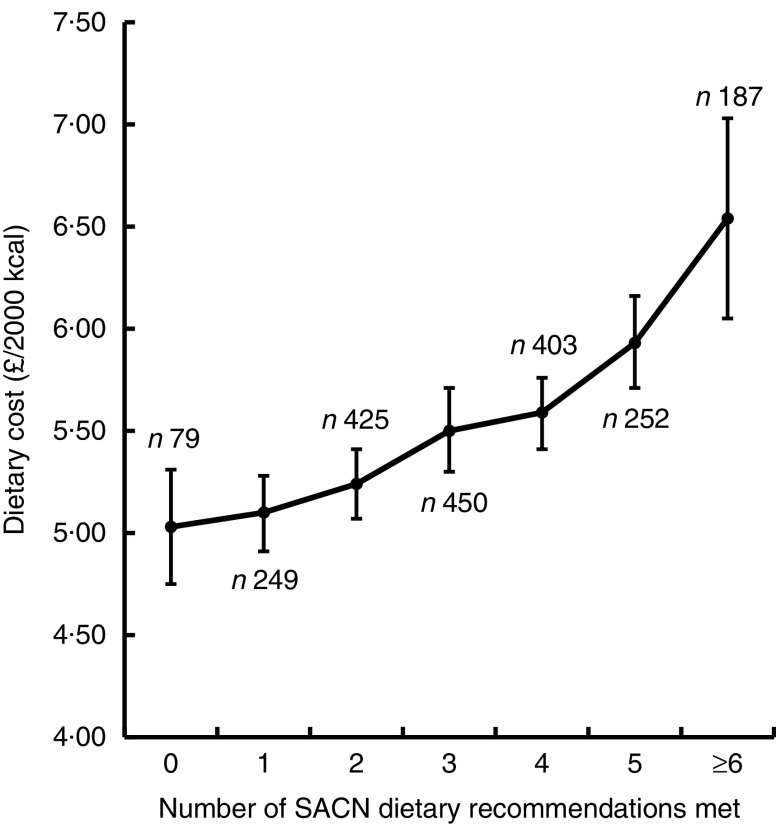
Fig. 2.
Mean diet cost (with 95 % CI represented by vertical bars) for diets in relation to the number of UK dietary recommendations met for key nutrient and food groups (advised by the Scientific Advisory Committee on Nutrition (SACN)) adjusted for age, sex and occupational social class. Dietary data from 2045 adults participating in Years 1–4 of the UK National Diet and Nutrition Survey Rolling Programme, 2008–2012 (1 kcal=4·184 kJ)

