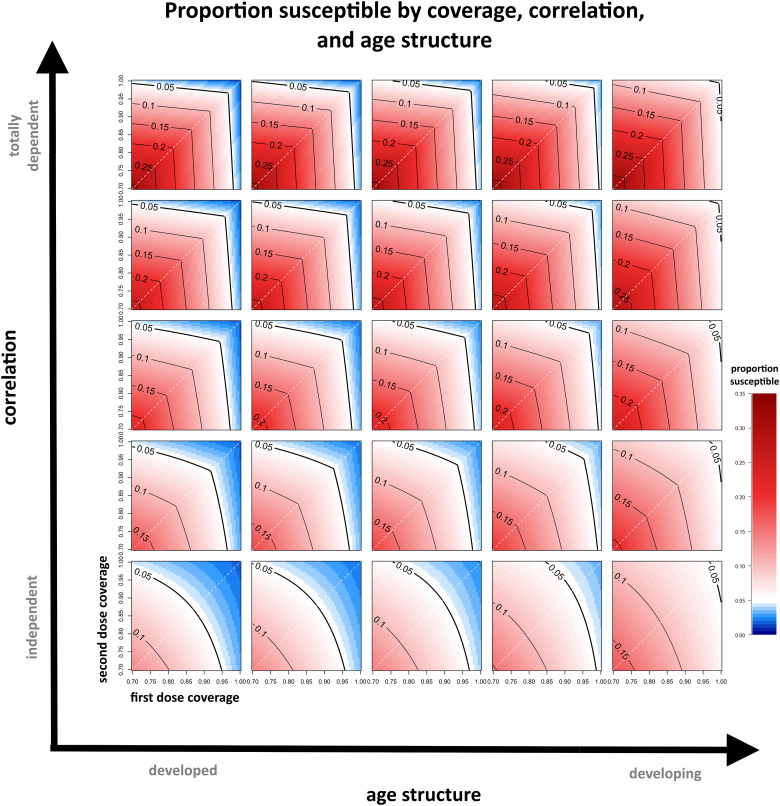
Fig. 2.
The susceptible proportion remaining for a range of first- and second-dose coverages, correlations and age structure parameters. The contours indicate various threshold levels of immunity, where <5% susceptible within the population is generally considered sufficient to maintain elimination and is coloured in blue. The white dashed line indicates where the coverage of each dose is equal.

