. 2017 Aug 29;8(11):7566–7575. doi: 10.1039/c7sc03321d

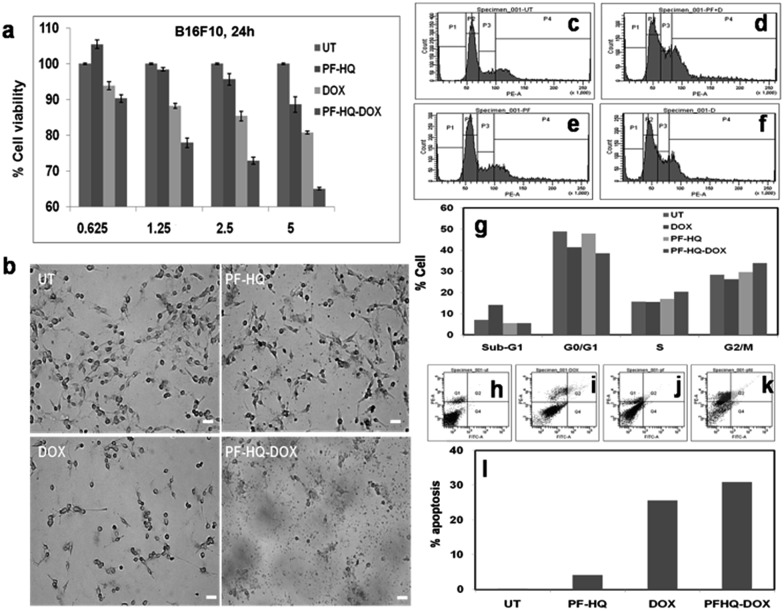
Fig. 5. (a) In vitro cell viability assay of B16F10 cancer cells incubated with PF-HQ, DOX, and PF-HQ–DOX in a dose-dependent manner for 24 h of treatment. The numerical value in the abscissa represents the concentration (μM) of DOX treatment. (b) Representative bright field images of B16F10 cells incubated with PF-HQ, DOX (2.5 μM), and PF-HQ–DOX (2.5 μM w.r.t. DOX) for 24 h were taken using an inverted microscope at 10× magnification. Scale bar = 50 microns. (c–g) The total DNA content was analyzed using PI/RNase by FACS in (c) untreated B16F10 cells as a control, and B16F10 cells treated with (d) free DOX (2.5 μM), (e) PF-HQ, or (f) PF-HQ–DOX (2.5 μM w.r.t. DOX) for 24 h. (g) Quantification of cell cycle analysis. (h–l) Analysis of apoptosis by flow cytometry using Annexin V-FITC assay in B16F10 cells treated with (i) DOX (2.5 μM), (j) PF-HQ, and (k) PF-HQ–DOX (2.5 μM w.r.t. DOX). (h) Untreated control cells were kept as a control. (l) Quantification data of apoptosis.

Fig. 5