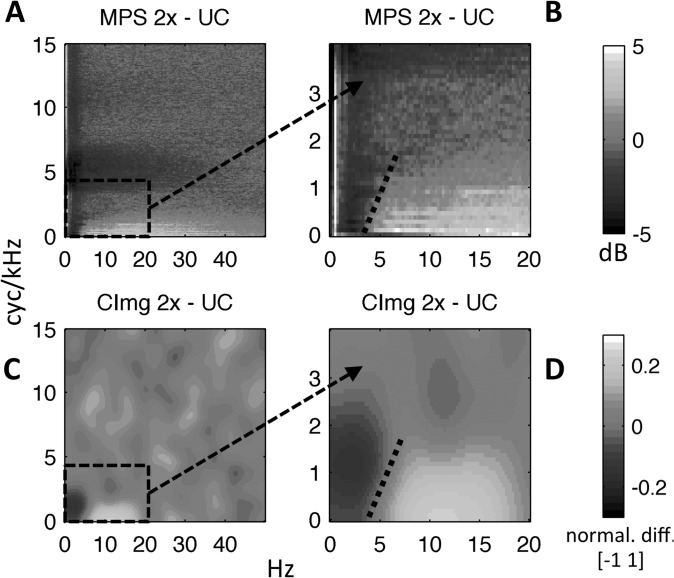
FIG. 10.
(Color online) (A) “Difference” modulation power spectrum (2× − UC) reproduced from Fig. 3(C). (B) Zoomed view of (A) focusing on low temporal and spectral modulation rates. Note the scale change on the axes. (C) “Difference” CImg (2× − UC) formed by scaling z-scored group-level CImgs to the range [0 1] and subtracting the scaled UC CImg from the scaled 2× CImg. Values can take the range [−1 1]. Light pixels (yellow online) reflect a relatively greater contribution to intelligibility for 2× vs UC. Dark pixels (purple online) reflect a relatively greater contribution to intelligibility for UC vs 2×. (D) Zoomed view of (C) focusing on low temporal and spectral modulation rates. Note the scale change on the axes. Dotted lines in B/D show the boundary between light (yellow online) and dark (purple online) pixels. For all plots, temporal modulation rate is plotted along the x axis (Hz) and spectral modulation rate is plotted along the y axis (cyc/kHz).

