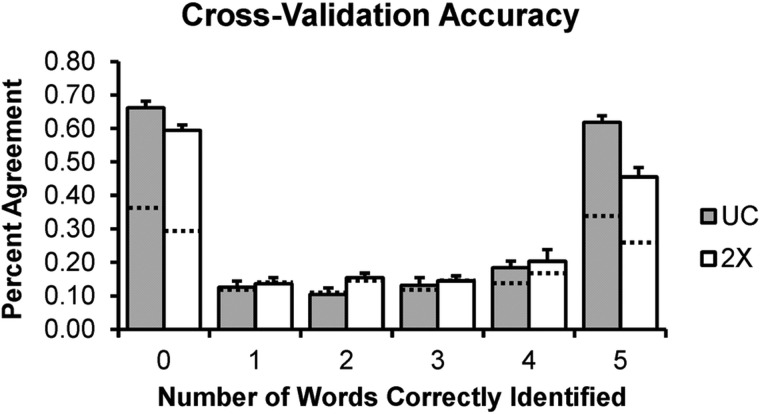
FIG. 11.
Performance in hold-one-block-out cross validation of bubbles-based CImgs for UC (grey bars) and 2× (white bars) groups. Height of the bars indicates the across-participant average percent agreement between predicted and true responses. True responses are binned by number of keywords correctly identified (0–5, x axis) with percent agreement calculated separately for each bin. Dashed lines show chance performance determined on the basis of a null distribution formed by repeating the cross-validation procedure 1000 times with the order of true responses shuffled.

