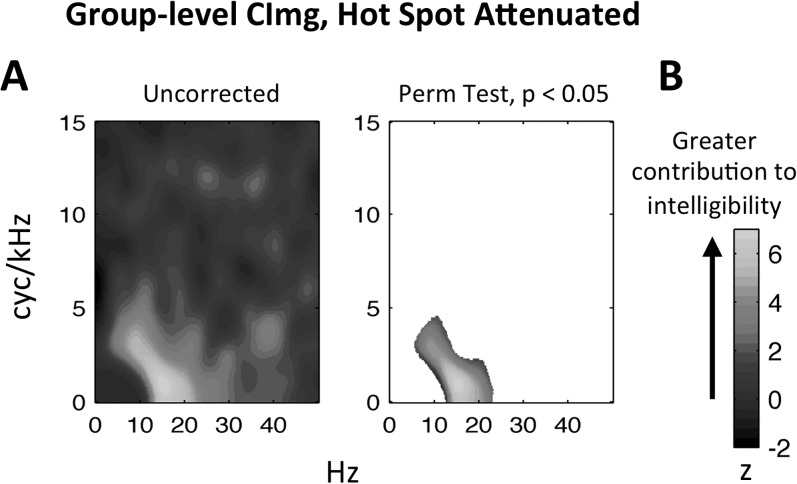
FIG. 12.
(Color online) (A) Unthresholded group-level CImg for uncompressed speech with the original bubbles “hot spot” removed by attenuating the magnitude of the modulation power spectrum in that region by a factor of 0.15. This prevented the hot spot region from accounting for variance in performance. (B) Thresholded version of (A). Pixels not exceeding threshold have not been assigned a color value (i.e., appear white). The threshold criterion was established on the basis of a null distribution formed by estimating 1000 group-level CImgs with participants' responses shuffled. Colormap reflects the normalized magnitude (z-score) of the CImg, where larger z-scores indicate a greater contribution to intelligibility. Temporal modulation rate (Hz) is plotted along the x axis and spectral modulation rate (cyc/kHz) is plotted along the y axis.

