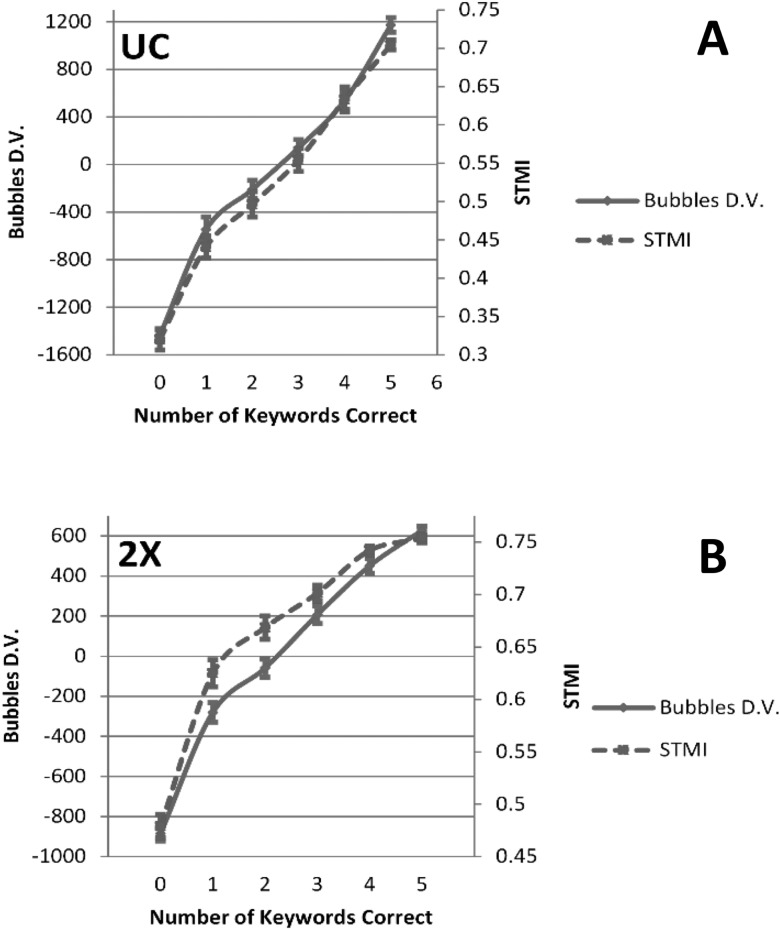
FIG. 13.
(Color online) (A) Mean values of the bubbles-based decision variable (solid, left axis) and STMI (dashed, right axis) for the UC group. Values are binned by number of keywords correctly identified (i.e., performance, x axis). (B) Plot organized as in (A), but for the 2× group. For all plots, error bars reflect ±1 SEM.

