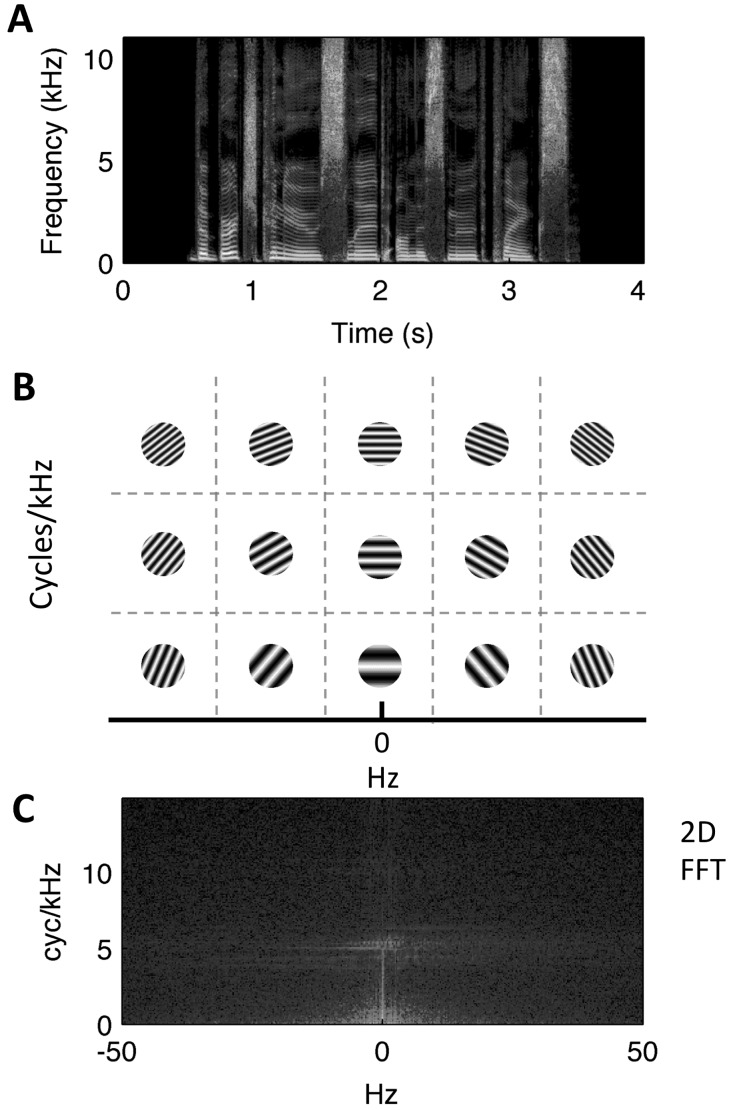
FIG. 2.
(Color online) (A) Spectrogram of an example sentence (“the birch canoe slid on the smooth planks”). (B) Schematic of the 2D Fourier transform operation, which decomposes the spectrogram into spectrotemporal ripple components (light/dark gratings) at different temporal (x axis, Hz) and spectral (y axis, cyc/kHz) modulation rates. Each ripple component is a 2D sinusoid in time-frequency space (i.e., a unique combination of spectral and temporal modulation rate). (C) The sentence modulation power spectrum (outcome of the 2D Fourier transform). A pixel in this representation corresponds to a single square as depicted in (B). The color scale (dB, arbitrary ref.) indicates the relative amount of energy across joint spectrotemporal modulations (light = more energy, dark = less energy).

