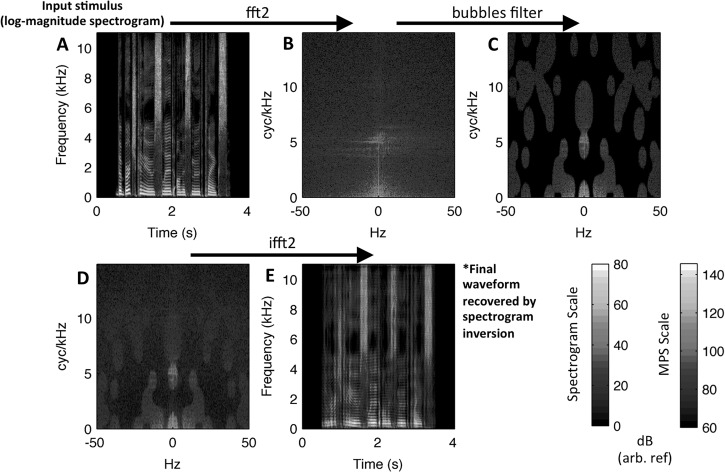
FIG. 4.
(Color online) Schematic of the bubbles filtering procedure. The MPS is obtained by 2D Fourier transform of the spectrogram, and random components of the MPS are nulled according to the bubbles filter pattern (top row). A filtered speech spectrogram is obtained from the modified MPS by inverse 2D Fourier transform (bottom row). Finally, a filtered waveform is obtained by iterative spectrogram inversion (not pictured). (A) Stimulus spectrogram. (B) Unfiltered modulation power spectrum. (C) Application of bubbles. (D) Filtered modulation power spectrum. (E) Filtered spectrogram. Decibel scales are relative to an arbitrary reference.

