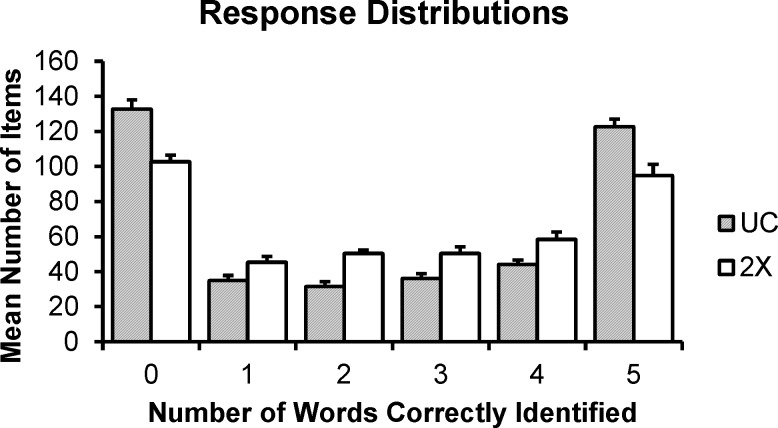
FIG. 5.
Distribution of responses in the UC (grey bars) and 2× (white bars) groups. Responses are binned by number of keywords correctly identified (i.e., performance; x axis). Height of bars gives the average number of trials for which a given level of performance was achieved. Error bars reflect 1 SEM.

