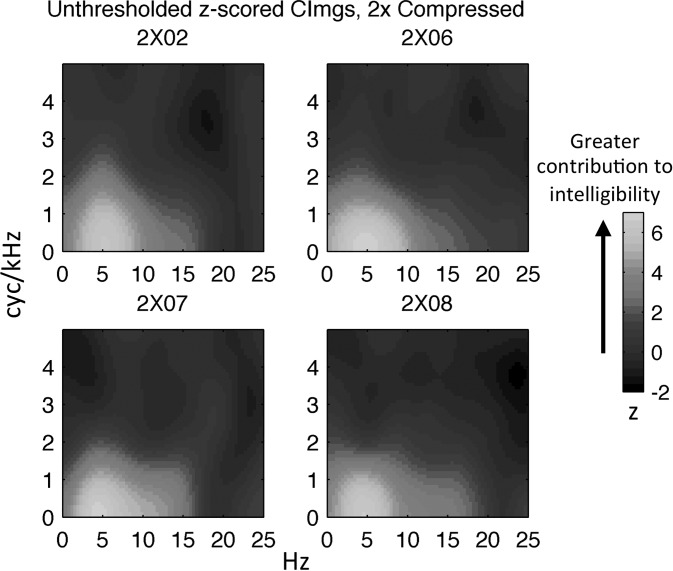
FIG. 7.
(Color online) Individual participant CImgs for the 2× group. Colormap reflects the normalized magnitude (z-score) of the CImg, where larger z-scores indicate a greater contribution to intelligibility. Temporal modulation rate (Hz) is plotted along the x axis and spectral modulation rate (cyc/kHz) is plotted along the y-axis. Individual CImgs are labeled with participant codes.

