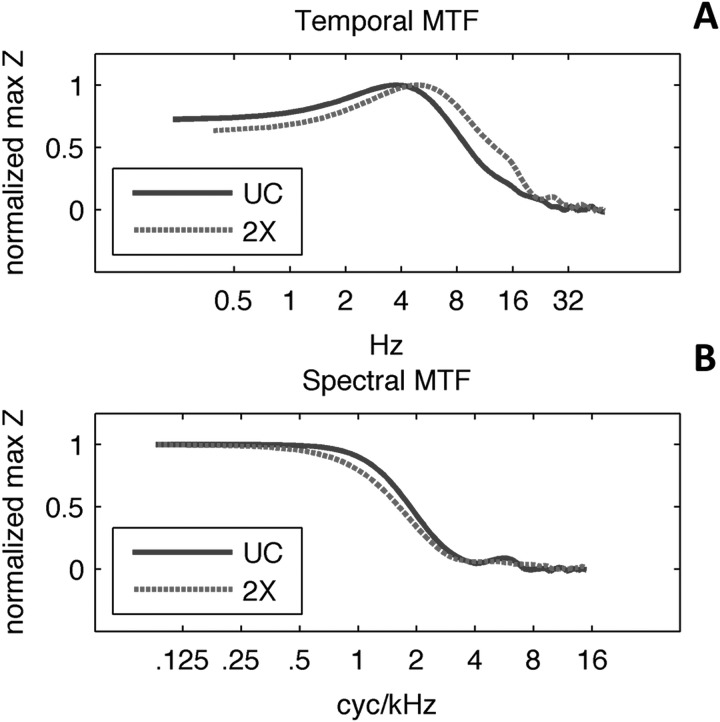
FIG. 9.
(Color online) (A) Group-level temporal modulation transfer functions. Plots reflect the maximum z-score value obtained along the spectral modulation dimension of the group CImg, as a function of temporal modulation rate (Hz). Function heights have been normalized to a maximum value of 1. (B) Group-level spectral modulation transfer functions. Plots reflect the maximum z-score value obtained along the temporal modulation dimension of the group-level CImg, as a function of spectral modulation rate (cyc/kHz). Function heights have been normalized to a maximum value of 1.

