. 2017 Aug 30;8(11):7604–7610. doi: 10.1039/c7sc01475a

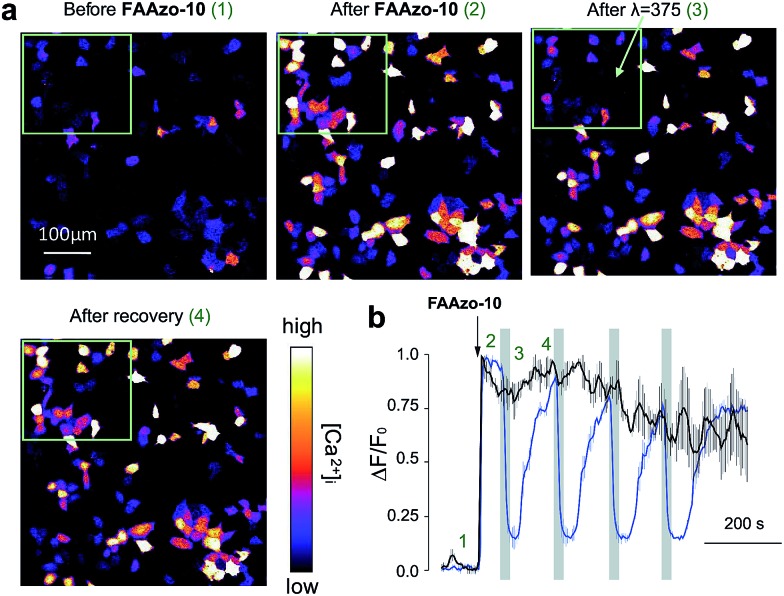
Fig. 4. Spatial control of GPR40 signalling with FAAzo-10. (a) Confocal images of HeLa cells expressing GPR40 and R-GECO before and after treatment with FAAzo-10 (200 nM) and illumination with 375 nm light. The green rectangle indicates the area of illumination. After addition of FAAzo-10, all transfected cells showed increased [Ca2+]i. Following illumination, only cells within the green rectangle showed a sharp decrease in [Ca2+]i levels, which recovered after termination of illumination. Scale bar = 100 μm. (b) Normalized [Ca2+]i in illuminated cells (within the green rectangular in (a)) in blue (n = 52) and those in unilluminated cells (outside the green rectangular) in black (n = 82). Time points 1–4 correspond to the respective time frames in (a). Error bars were calculated as ±s.e.m.

Fig. 4