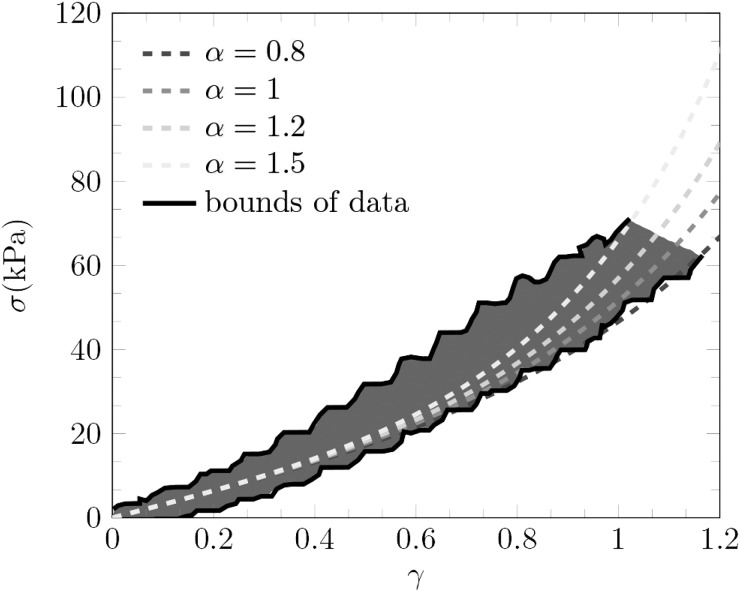
FIG. 11.
(Color online) Stress-strain curve for torsion experiments of agar at large strain. The black lines correspond to the bounds of the experimental data (gray region) reported in Barrangou et al. (Ref. 56) for agar measured at strain rate of 0.17 s–1.

