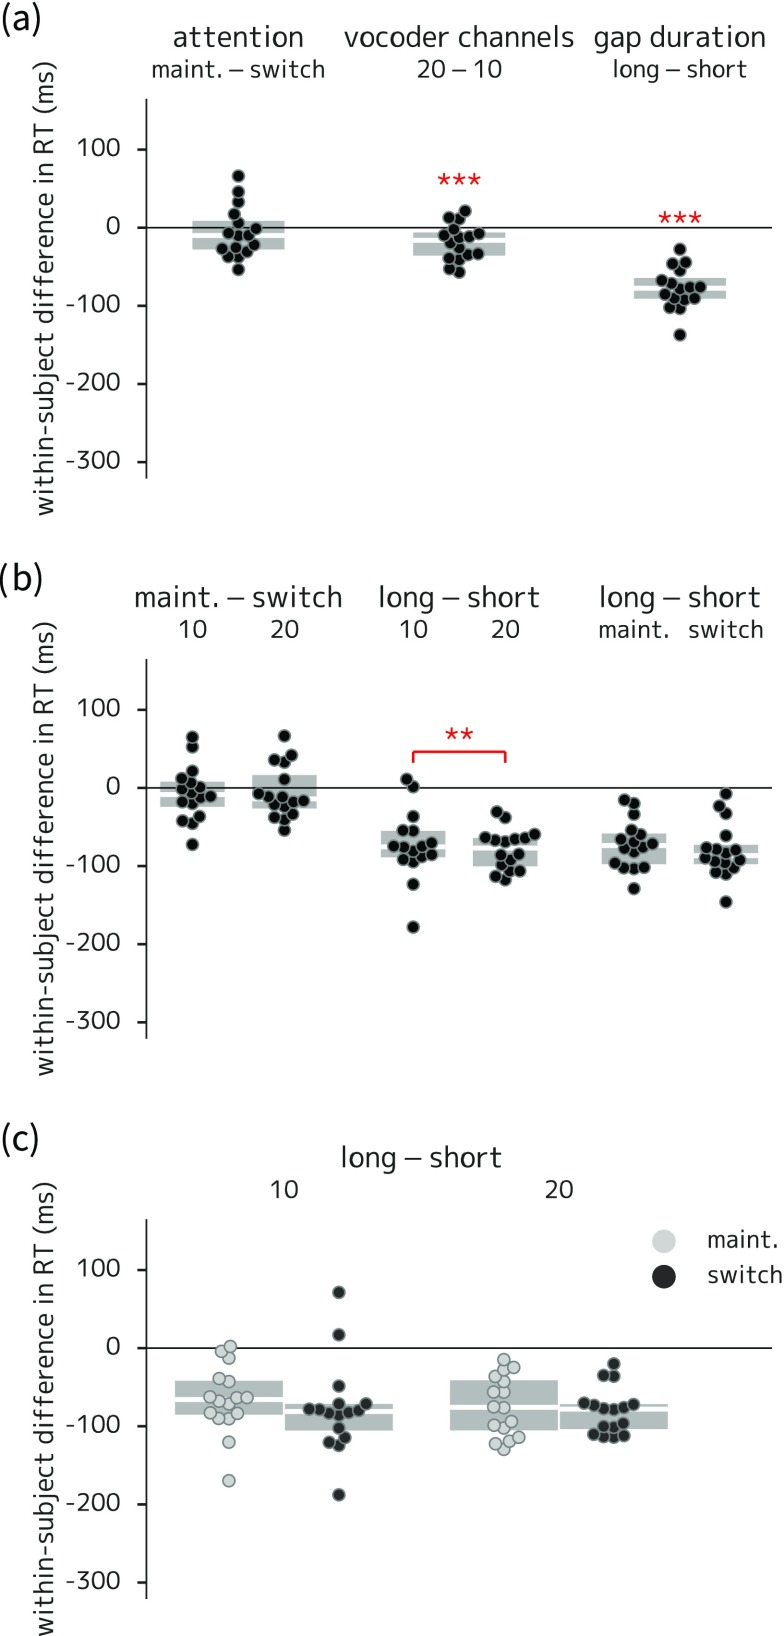
FIG. 7.
(Color online) Box-and-swarm plots of between-condition differences in reaction time for experiment 2. Boxes show first and third quartiles and median values; individual data points correspond to each listener; asterisks indicate comparisons with corresponding coefficients in the statistical model that were significantly different from zero. (a) Main effects of attention, spectral degradation, and gap duration (faster response time in trials with 20-channel vocoding, and in long-gap trials). (b) Two-way interactions (larger difference in reaction times between long- and short-gap trials in the 10- versus the 20-channel condition). (c) Three-way interaction (no statistically significant difference). *** = p < 0.001.

