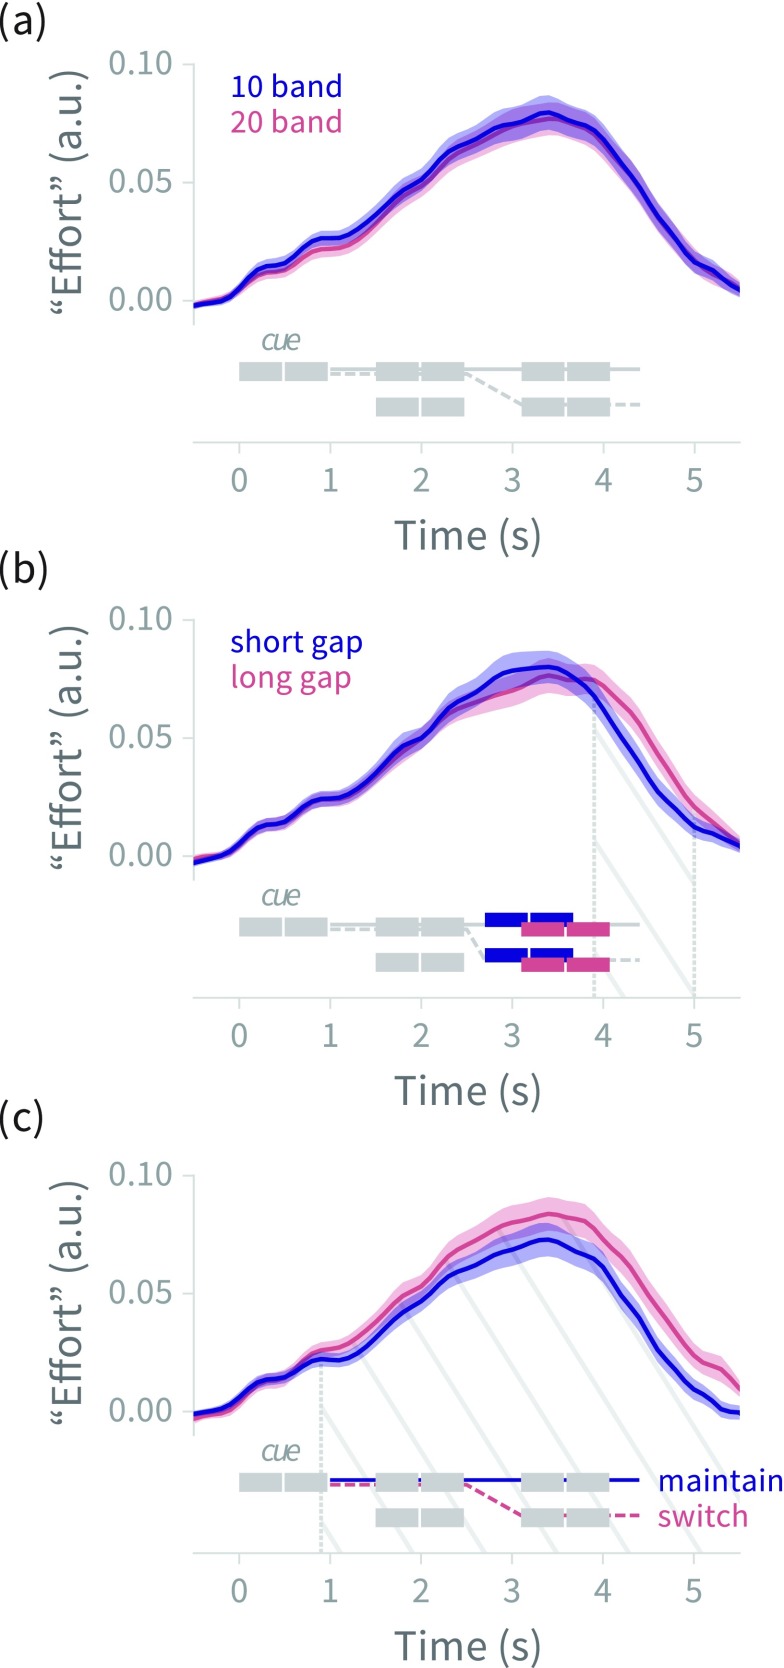
FIG. 8.
(Color online) Deconvolved pupil size (mean ±1 standard error across subjects) for (a) 10- versus 20-band vocoded stimuli, (b) 200 versus 600 ms mid-trial switch gap durations, and (c) maintain- versus switch-attention trials, with trial schematics showing the time course of stimulus events (compare to Fig. 5). Hatched region shows temporal span of statistically significant differences between time series. The late-trial divergence in (b) is attributable to the delay of stimulus presentation in the long-gap condition; the onset of divergence in (c) aligns with the end of the cue, as in experiment 1 [see Fig. 4(c)]. a.u. = arbitrary units (see Sec. II A 5 for explanation of effort).

