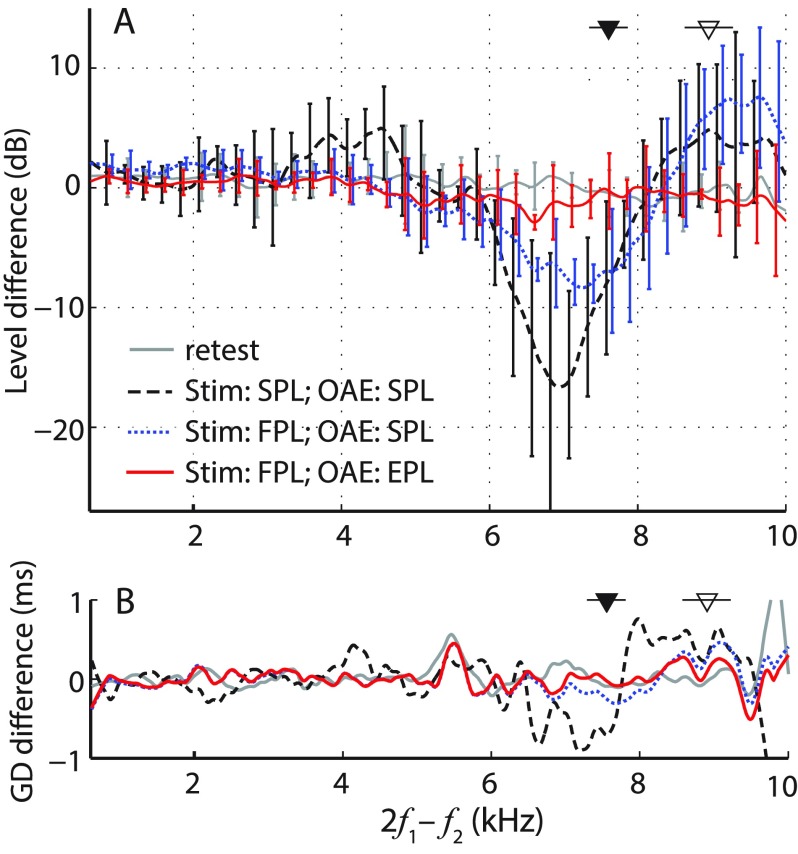
FIG. 3.
(Color online) Mean differences (±1 SD) in measured DPOAE levels (A) and group delays (B) due to changes in probe insertion depth (deep minus shallow, n = 5). Data with a SNR less than 6 dB were excluded from the calculations (16%–19% of the data, depending on the curve), and the results were gently smoothed (post-averaging). For clarity, error bars for the level data are shown at intervals of 0.25 kHz and are omitted entirely for the group-delay data, for which the SDs averaged around 1–2 ms. Dashed black and dotted blue lines show differences for DPOAEs (measured with SPL- and FPL-calibrated stimuli, respectively) expressed as total pressure (SPL). The solid red line shows differences for DPOAEs (measured with FPL-calibrated stimuli) expressed as EPL. For comparison, the gray line shows the test–retest repeatability of DPOAEs obtained at the same probe position. Triangles indicate mean fλ/2 (±1 SD) for shallow (filled) and deep (open) probe insertion depths.

