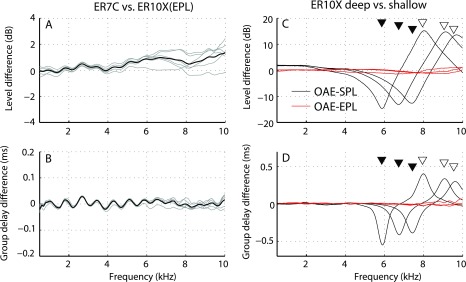
FIG. 4.
(Color online) Validating the conversion to emitted pressure using measurements in simple tubes. Panels (A) and (B) show differences in levels and group delays, respectively, between emitted pressures derived from measurements in the short tube with the ER10X [using Eq. (2)] and measured in the long tube with the ER7C (see setup in Fig. 2). Gray lines show individual measurements; black lines, the means. Ideally, level and group delays differences are zero. Panels (C) and (D) show the difference in levels and group delays between “OAEs” measured with the ER10X at pairs of shallow and deep probe placements. Black lines show differences between OAEs expressed in conventional form as total pressure; red lines show corresponding differences in emitted pressure. Triangles mark the half-wave resonant frequencies for shallow (open symbols) and deep (closed symbols) probe positions. Paired measurements are indicated by triangles placed on the same horizontal line.

