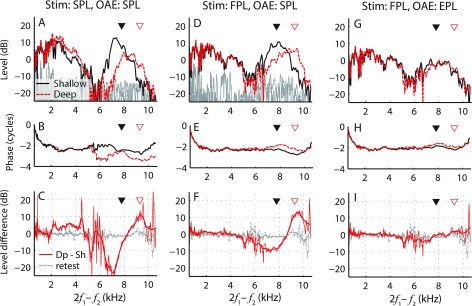
FIG. 6.
(Color online) DPOAE magnitudes (upper panels) and phases (middle panels) measured at shallow (black solid line) and deep (red dashed line) probe insertion depths in one subject (036). In the bottom panels, the red lines show changes in the DPOAE level resulting from manipulating the probe position (thick lines show the data after gentle smoothing). The three columns show data obtained using different combinations of stimulus calibration procedures (SPL vs FPL) and/or DPOAE pressure metrics (SPL vs EPL). For comparison, the dashed gray lines show the test–retest variability in the DPOAE level (dB SPL) at the shallow position obtained with FPL stimulus (bottom panels). Triangles mark the half-wave resonant frequencies for each probe position. Noise levels (in dB SPL) are shown in gray when appropriate (upper panels).

