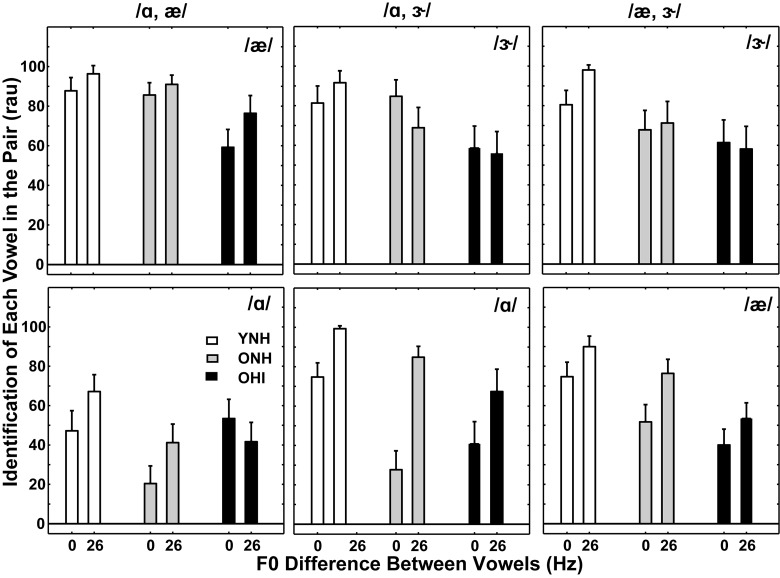
FIG. 8.
Mean identification scores (in rau) for each vowel for three additional different-vowel pairs (shown at the top of each panel) for the smallest (0 Hz) and largest (26 Hz) F0 differences. Scores for YNH subjects are the left two bars (white), scores for ONH subjects are the middle two bars (gray), and scores for OHI subjects are the right two bars (black). The individual vowel of the pair is labeled within each panel. Error bars indicate ±1 SEM.

