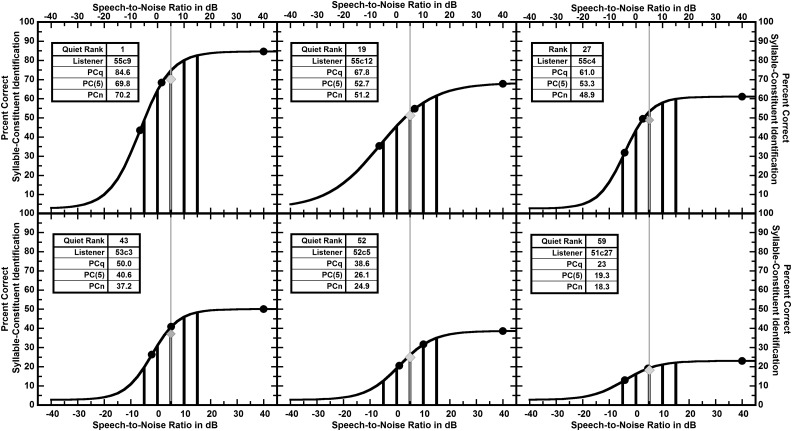
FIG. 3.
Data points (filled circles), fitted logistics (curves), and interpolated points over the range of commonly encountered SNRs (thick vertical lines) are shown for a sample of six listeners selected so that their scores in quiet (PCq's) are spaced at about 12% intervals. The averages of the interpolated points (PCn's) are shown as grey diamonds. The thin grey vertical lines are at an SNR of 5 dB (Smeds et al., 2015), the average SNR encountered by hearing-aid users. Each listener's percent correct at the SNR of 5 dB (PC(5)) is given by the intersection of the vertical grey line and the fitted logistic. Note that the interpolated points are near to or between the observed points. These graphs are typical of those for all of the 59 listeners, which can be viewed at the link provided in the supplementary material.

