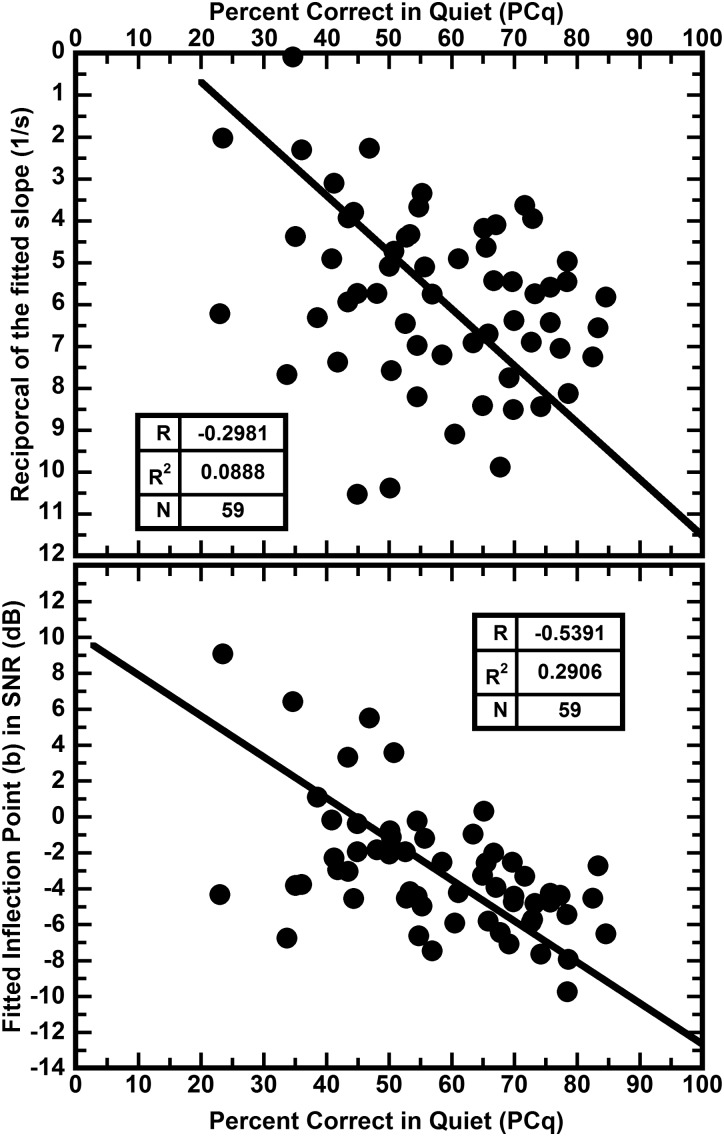
FIG. 6.
Showing the relation between the fitted slopes (upper panel) and inflection points (lower panel) of the logistic and the identification scores in quiet. Model II regression lines are shown (Sokal and Rohlf, 1995). The upper panel shows that there is a weak tendency for the slope to decrease as PCq increases. The lower panel shows that the SNR at the fitted inflection point decreases as the PCq increases. Both relations combine to increase the score in noise as the score in quiet increases.

