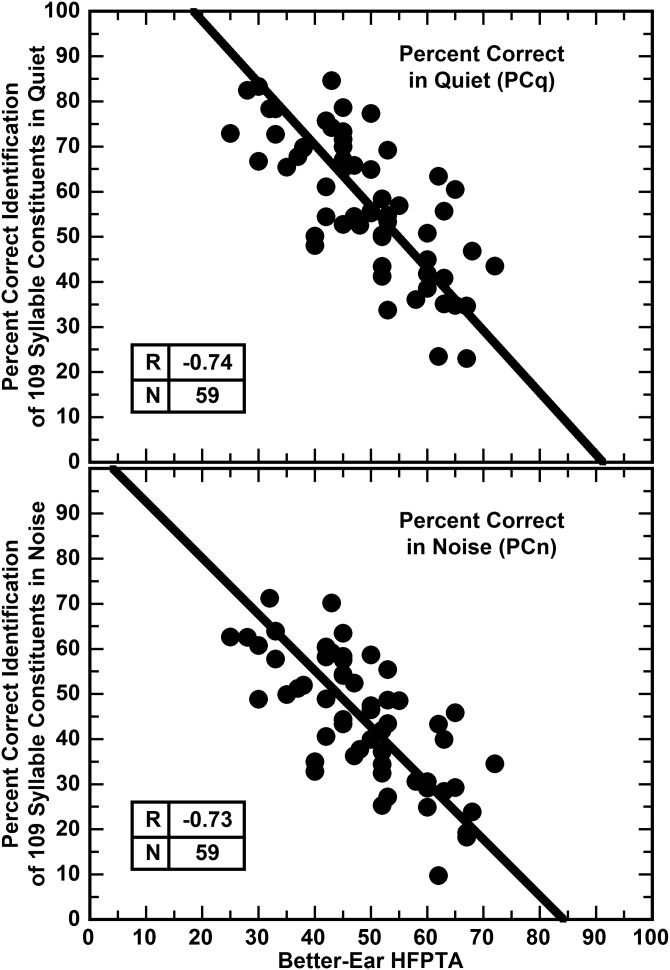
FIG. 7.
Scatter plots of syllable-constituent identification in quiet, PCq, (upper panel) and syllable-constituent identification in noise, PCn, (lower panel) against the high frequency pure tone average, HFPTA, are shown for the 59 hearing-aid users. The model II regression lines (Sokal and Rohlf, 1995) are shown. The corresponding correlations are shown in the inset tables on each panel. The y-intercept on the lower panel suggests that the loss of the ability to identify syllable constituents in noise begins with HFPTAs as low as 5 dB HL. It is also apparent that considerable variance remains after allowing for the HFPTA.

