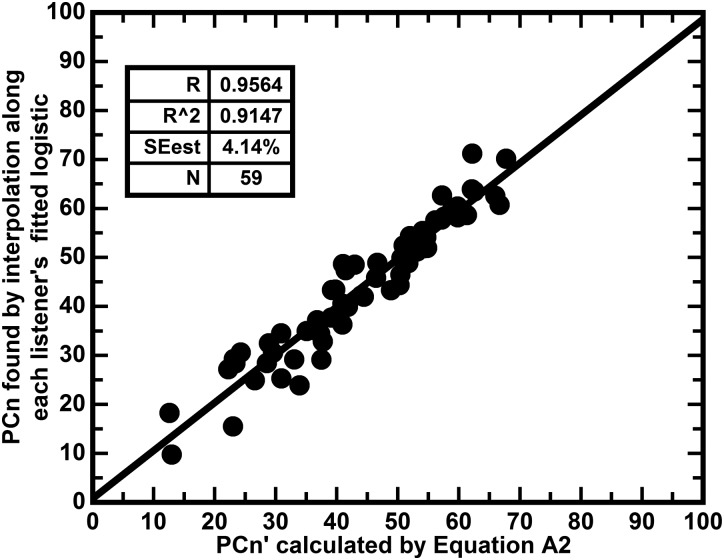
FIG. 9.
Showing the correlation between PCn′ calculated by Eq. (A2) and the PCn found by interpolation along each listener's fitted logistic. It can be seen that this relation is slightly less constrained than that shown in Fig. 8. While the multiple R accounts for 98.3% of the variance in PCn, when only ua is used the R accounts for 91.5% of the variance in PCn. This difference is mirrored in the standard errors of the estimates.

